Stock Market Prediction with LSTM Neural Networks
CS 5824: Final Project
Jostein Barry-Straume
![]()
Table of Contents
- Team Members
- Abstract
- Pertinent Links
- Introduction
- Related Work
- Background
- Method
- Results and Evaluation
- Sources
Team Members
Abstract
In this paper, I present an evaluation of hyperparameter impact on validation accuracy for an optimized Long-Short-Term-Memory (LSTM) Neural Network (NN). LSTMs are widely used as the go-to architecture for time series forecasting. I used Google Colab to train and test 84 models to find the optimal hyperparameters with which to apply a LSTM towards the Stock Market Dataset available on Kaggle. I was able to realize a validation accuracy of 99.14% on a given Exchange Trade Fund. I found that neural density appears to have the least impact on validation accuracy, whereas the time spent training and the amount of epochs had the largest impact.
Pertinent Links
- Video presentation can be found here
- Slides from the presentation can be found here
- Code for this final project can be found here
- Final report paper can be found here
Introduction
Part of my long-term career goals involves working as a financial quantitative analyst. Working directly with financial data would go a long way towards having a project portfolio that aligns with what firms are looking for. Personally, I also just have an interest in investing. However, portfolios less than $20,000 – 25,000 are often restricted to a given amount of “day trades.” Violating this limit can invoke temporary pauses on trading with said account. To get around this, I am targeting strategies that involve at least a 24-hour holding period.
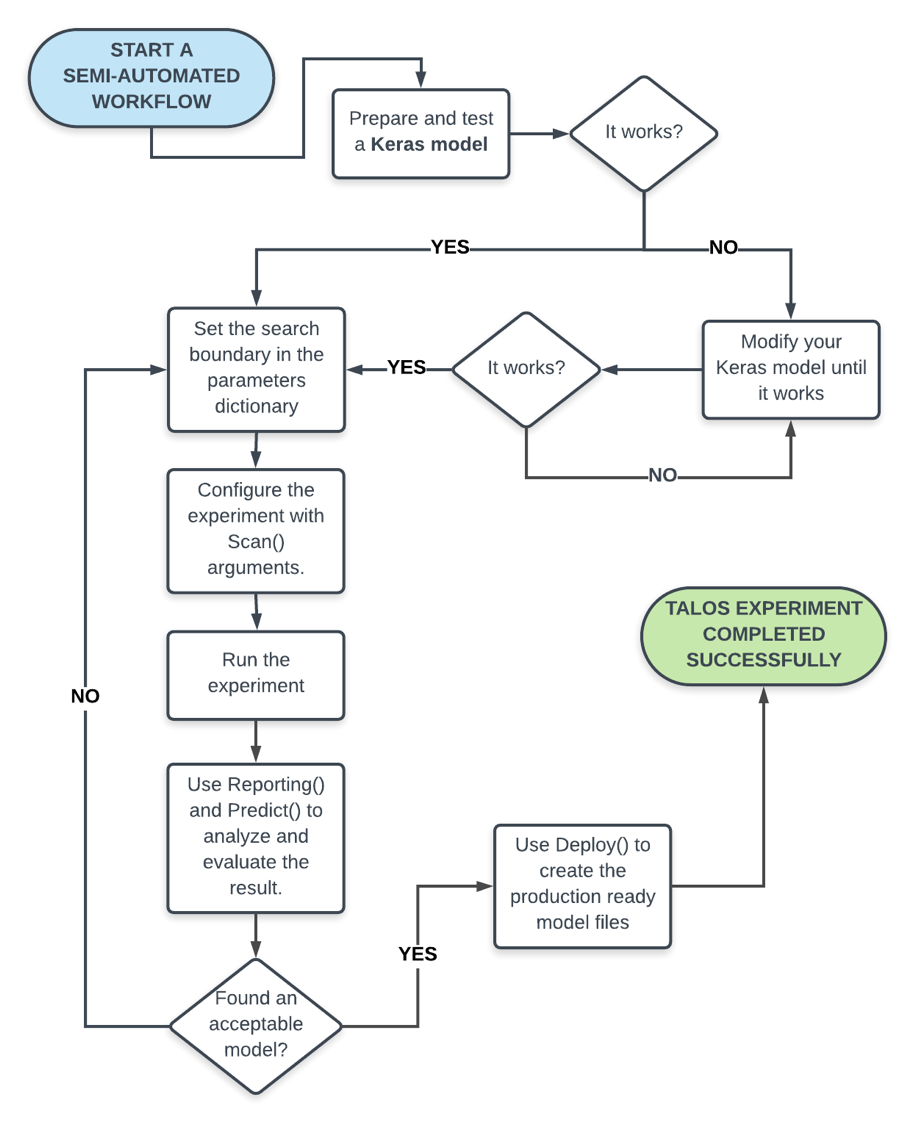
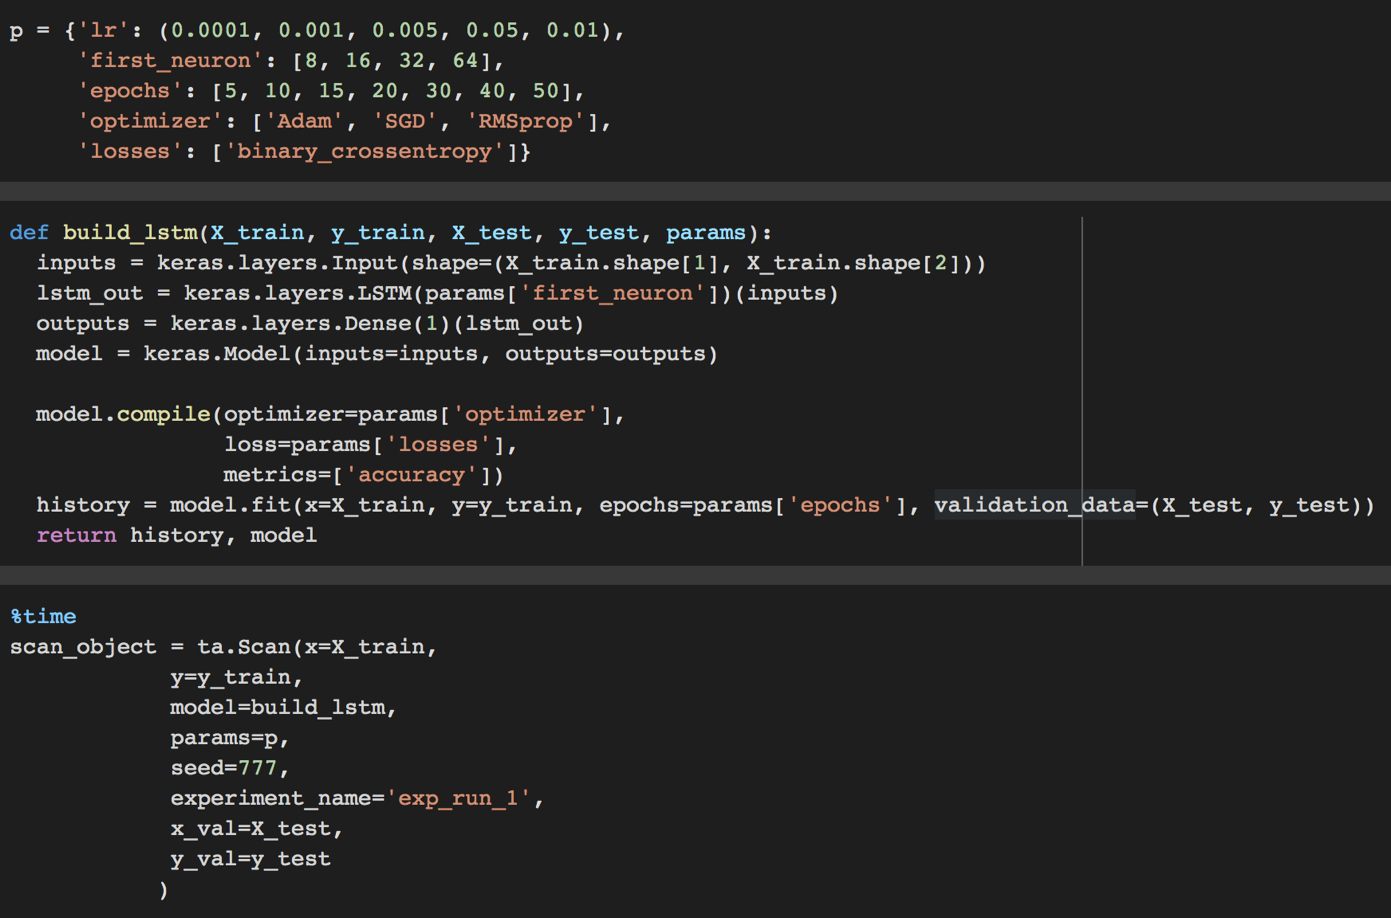
In this case study, the application of Long-Short-Term-Memory (LSTM) Neural Networks (NN) is implemented such that several machine learning techniques are experimented with to tackle the following problem. Specifically, I experiment with diagnostically benchmarking and evaluating eighty-four different Long-Short-Term-Memory (LSTM) neural networks, to forecast time series data such that the future direction of a given stock or exchange-traded fund (ETF) can be predicted reliably.
Accomplishing this optimization problem necessitates subsetting the data into training and test sets. Note that because the movement of a stock or ETF is implicitly dependent on time, the data is not shuffled. However, the training and test datasets are split in a way to create a forecasting horizon window with which model evaluation can be performed.
Optimization of the hyperparameters of the LSTM NN is realized through two metrics. The model checkpoint provides a metric wherein a loss function is monitored throughout epoch training. If the given loss function does not improve, then the model is saved as the best model. The early stopping method halts training if the given loss function being monitored has not improved from the previous epoch. Utilizing both the model checkpoint and early stopping method maximizes accuracy while simultaneously minimizing training time for the LSTM NN.
Related Work
Coming soon.
Background
Coming soon.

Method
Task:
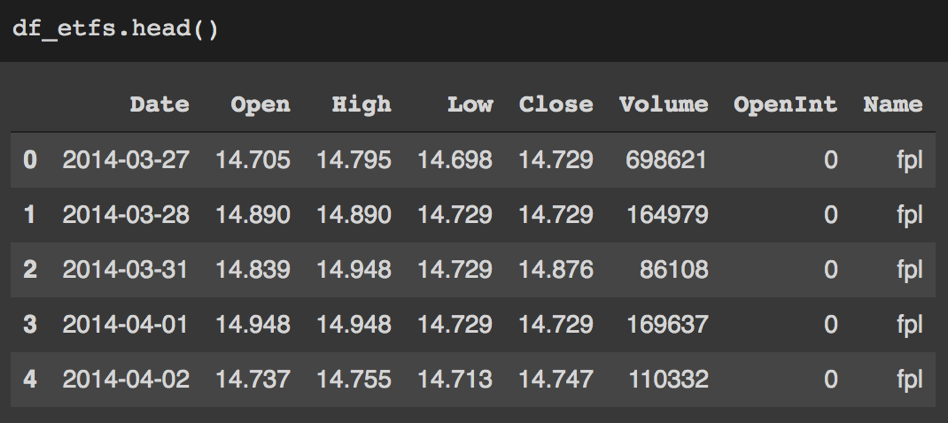
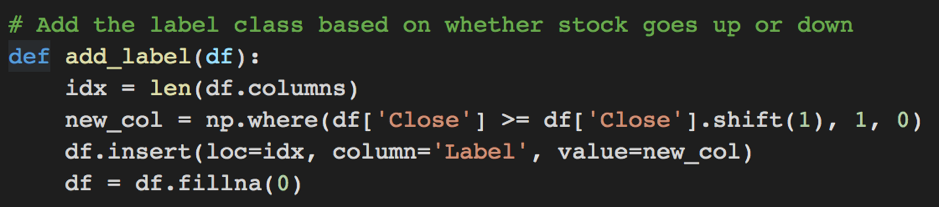
I believe this term project would be classified as a supervised learning problem. In other words, I am predicting results within a continuous output, which maps input variables to a continuous function. In this situation, the input variables are the four basic daily information columns given as a stock’s open, close, high, and low values for the day. From here, more nuanced technical indicators are calculated as further input variables. Moreover, the output variable would be the stock’s closing price where time t = i + 1. I am modelling this behavior by creating a binary label that captures if the stock held or increased versus decreased compared to the previous day.
Performance measure:
The performance measure for this project is validation accuracy. I am looking to see how accurate a model can correctly predict which way a stock or ETF will move. Although this is a very basic performance measure, it is one of the most necessary to determine if I have a well performing model. In the future, I hope to implement a couple other performance measures into my model evaluation, which I will talk about in the later sections of this presentation.
Learning component:
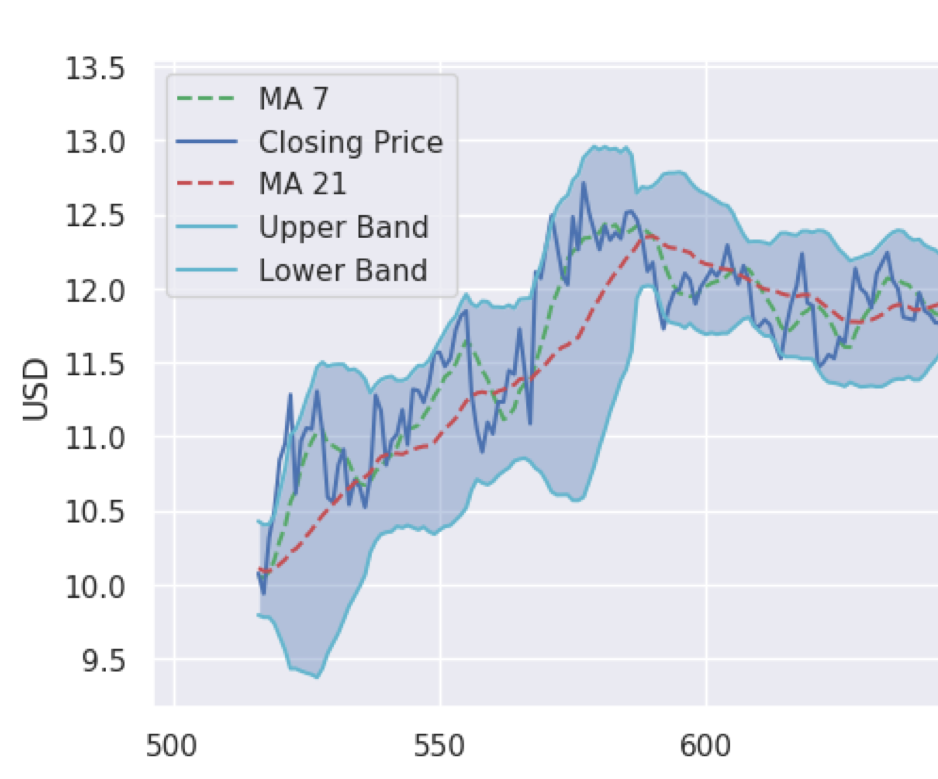
The learning component of this problem would be the technical indicators of a given stock or ETF. Specifically, the model will learn and implicitly adjust the weights for the stock’s technical indicators based on a lookback window of time. For example, one ETF had 916 days of financial history. The first 800 days were used as a lookback window. Then the last 116 days were used to validate the performance of the learning components.
Results
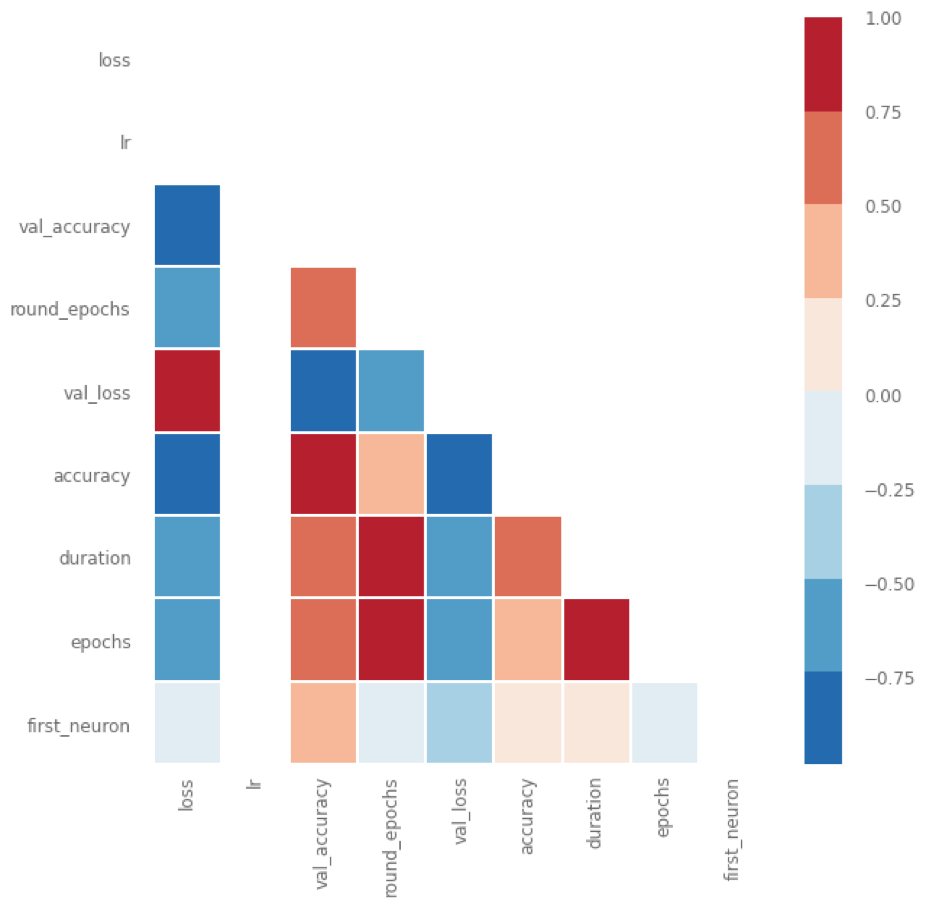
Validation Accuracy has strong, positive correlations with:
- Number of neurons
- Epochs
- Duration of training
- Round of epoch training
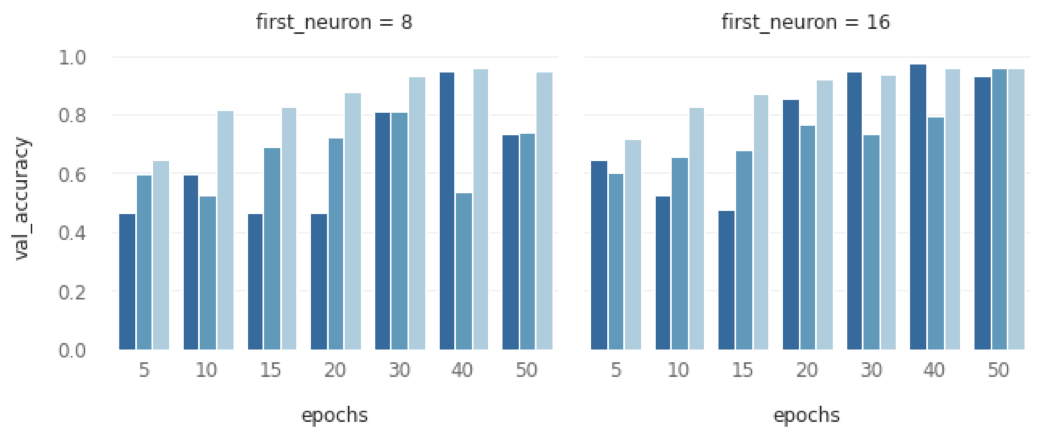
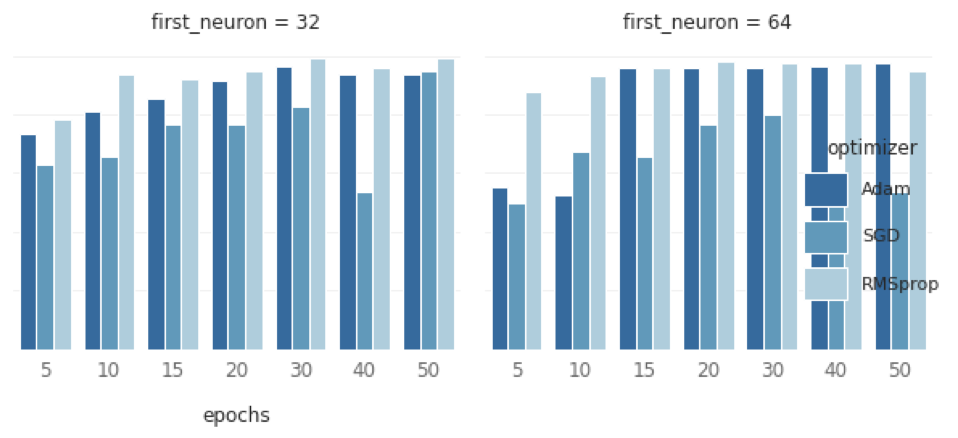
With regard to the distribution of validation accuracy among optimizers per each epoch level, overall distribution trend is logarithmic. In other words, as epochs increase (x-axis), validation accuracy increases. Moreover, the Adam optimizer has the largest variance, whereas the RMSprop optimizer has the smallest variance.
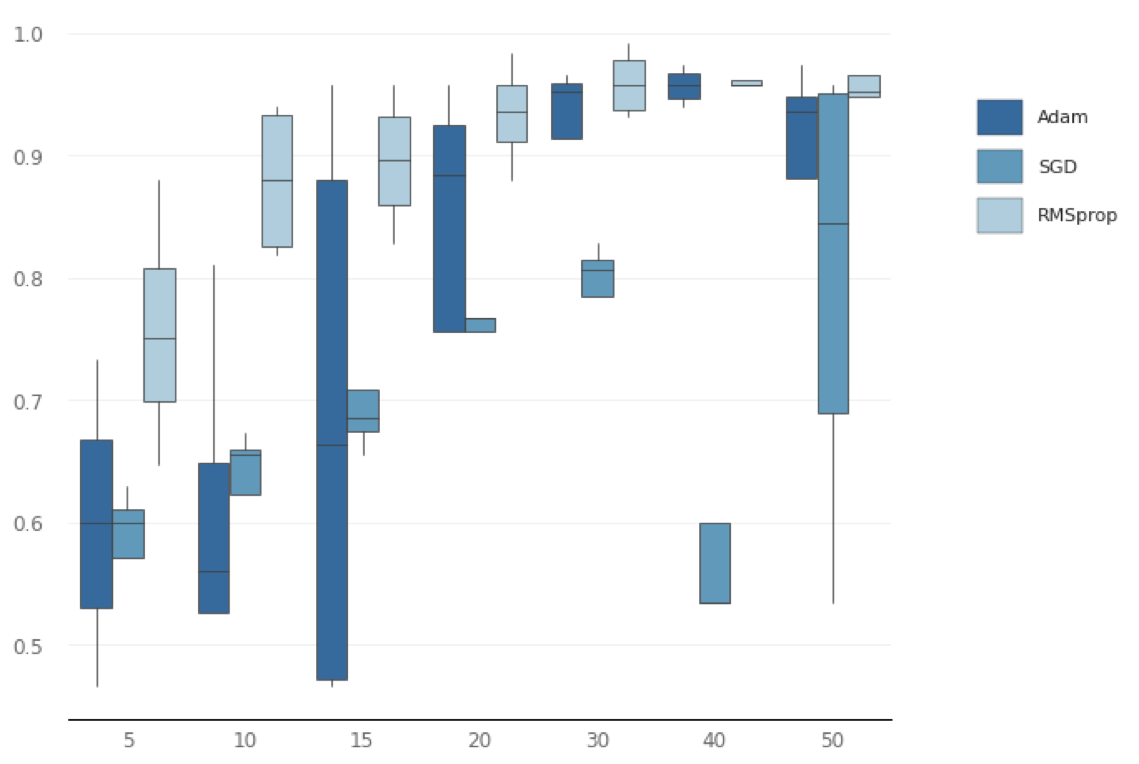
By breaking down validation accuracy for each neuron density by epochs per each optimizer: it can be shown that RMSprop performs consistently better in each neuron density. Additionally, SGD seems to struggle at highest neural density; perhaps overfitting?
Sources
- https://www.kaggle.com/kratisaxena/lstm-gru-models-for-stock-movement-analysis#LSTM-Model-for-Prediction-of-movement-of-stocks
- https://github.com/borisbanushev/stockpredictionai
- https://www.kaggle.com/jacksoncrow/stock-market-dataset